Stable value practitioners are frequently asked how the stable value asset class will respond in a rising interest rate environment. Consultants, plan sponsors and individual investors have expressed concern that stable value products could be disadvantaged should interest rates continue to rise. To help address their concerns, it is helpful to look at how stable value funds have performed during prior periods of rising interest rates and the characteristics that make stable value unique.
Historical Backdrop
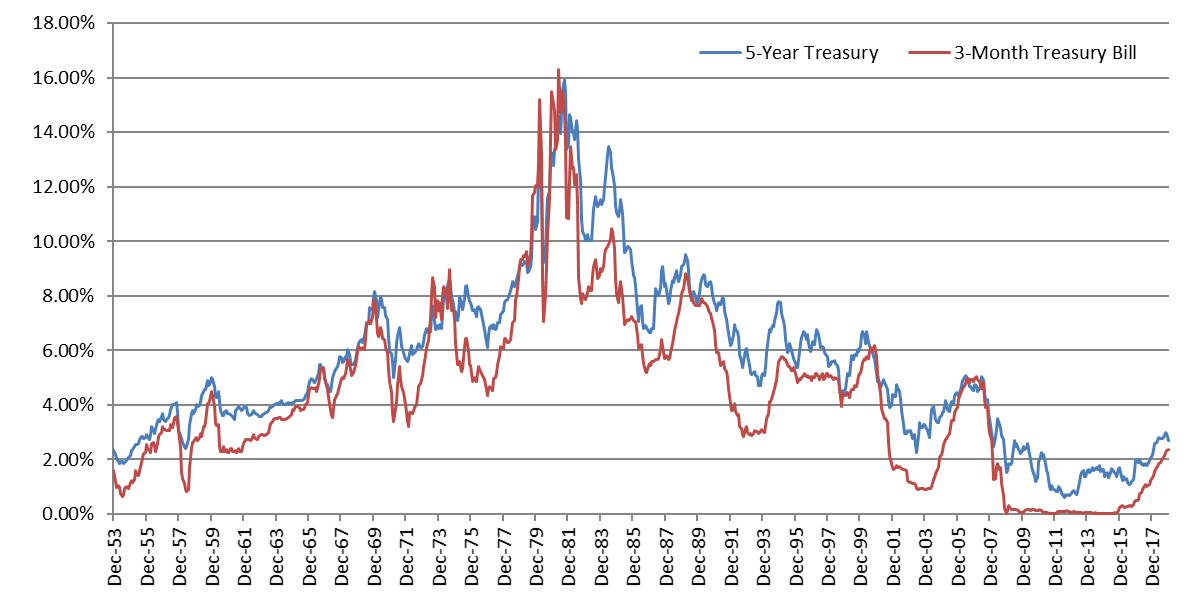
Many younger investors would struggle to remember a time when benchmark interest rates of any maturity were much above 5%, let alone into double-digits. Indeed, for the better part of 20 years we have been conditioned to expect a financial marketplace based upon low rates and moderate inflation. As Figure 1 reminds us, it wasn’t always this way. In the late 1970s and early 1980s, the U.S. economy was plagued by chronically high inflation and poor economic growth. The Fed, under then chairman Paul Volcker, successfully brought down the inflation rate from a peak of 13.6% through a restrictive monetary policy—laying the groundwork for almost three decades of declining interest rates and a secular bull market in bond prices.
In the aftermath of the Great Recession, the Ben Bernanke Fed, along with other major central banks, implemented unprecedented accommodative monetary policy. This resulted in a sustained period of about eight years of short-term interest rates at or near historic lows. In late 2015, the Fed shifted its stance and started to tighten its accommodative monetary policy with a 25 basis point interest rate hike. From December 2016 through the end of 2018, the Fed continued its policy normalization, raising interest rates another eight times. With this significant increase in short-term interest rates and continued signs of economic strength, investors are assessing the impact of rising interest rates and potential inflationary pressures on asset returns, including those of stable value funds.
Stable Value Crediting Rates in a Rising Rate Environment
Though rising interest rates can impact bond valuations, stable value offers investors unique protections against these risks. While dramatically rising rates – characteristic of a hyper-inflationary environment, for example – could negatively affect yields on stable value products, many experts believe that dramatic spikes in U.S. interest rates are much less likely today. The expansion of the global debt markets, along with the slowing rate of overall global economic growth, support the contention that the ceiling for interest rate increases is much lower today than in the late 1970s and early 1980s. The history of stable value products has shown that more moderate increases in rates are manageable and healthy for stable value funds. Moderate or somewhat gradual increases in market rates allow the reinvestment of portfolio cash flows at higher yields and should translate into higher crediting rates and greater future earnings potential for stable value investors.
The crediting rates of stable value funds generally follow market interest rate trends (as rates both rise and fall), but with a lag. In a rising interest rate environment, the mechanism for calculating crediting rates is designed to amortize marked-to-market losses that would normally be realized immediately in a fixed income portfolio’s market value. Absent any asset impairment issues, a stable value fund’s underlying bond portfolio is expected to gradually recover these unrealized market value losses as its bonds mature, continuing to capture incrementally higher yields (as well as maturity and credit/structure risk premiums) as cash flows are reinvested. The insulation from immediate mark-to-market losses and ability to take advantage of higher reinvestment rates together form the foundation of stable value’s primary value proposition.
Throughout the history of the stable value asset class (since the early 1980s), there have been five full interest rate cycles (see Figure 1), each characterized by expanding economic growth leading to inflationary pressures, restrictive monetary policy and rising short-term interest rates. During each of these periods, the stable value asset class performed as expected and delivered on its primary investment objectives of preserving capital and providing a competitive yield versus other low-risk alternatives.
Figure 1: An Historical Review of Interest Rates1
Short and Intermediate Rates (1953-2018)
Stable Value and Inverted Yield Curves
While the yield curve is usually positively sloped, there are periods when the yield curve becomes “inverted” – meaning short-term rates exceed intermediate and long-term rates. In this environment, money market funds may become a more attractive investment alternative, at least in the short run, relative to other conservative options such as stable value funds.
Since 1953, there have been 10 instances of yield curve inversion as measured by the difference between the 3-Month Treasury Bill and the 5-year constant maturity Treasury rate. During this nearly 7 decade period, the yield curve has only been inverted 7% of the time (see Table 1). On average, yield curve inversions lasted 5.5 months with an average difference in yield of 60 basis points. Typically driven by Fed actions to dampen inflationary pressures by making short-term borrowing more expensive, the inversions correspond closely with Fed policy and U.S. economic cycles and tend to be infrequent and short-lived. It is during these transitory periods in our nation’s economic history that money market funds might outperform stable value funds.
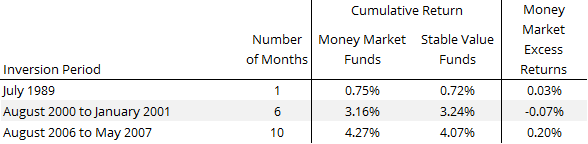
A review of yield curves over the last half century suggests a very small probability of money market funds outperforming stable value funds on a consistent, long-term basis. Over the last 30 years, the yield curve has inverted three times for a total of 17 months (see Table 2). Comparing money market returns with stable value returns shows that even during periods of inverted yield curves, money market funds have not dramatically or consistently outperformed stable value funds. In contrast, stable value funds have cumulatively outperformed money market funds by more than 40% for the same initial dollar amount invested over that 30-year period.4
Table 1: Periods of Inverted Yield Curves2
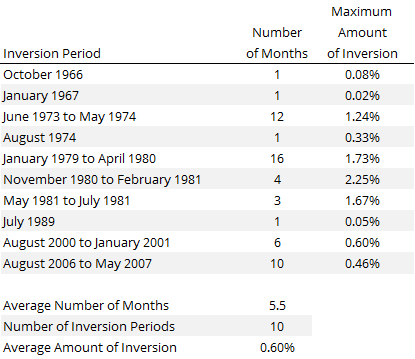
Table 2: Total Returns of Money Market Funds and Stable Value Pooled Funds During Periods of Inverted Yield Curves3
Looking Forward
There is strong consensus among market participants that we are nearing the end of the current economic cycle. If the Fed’s recent pause in its tightening of monetary policy holds and interest rates stabilize, we should see stable value crediting rates gradually reset higher as they reflect the new elevated level of interest rates.
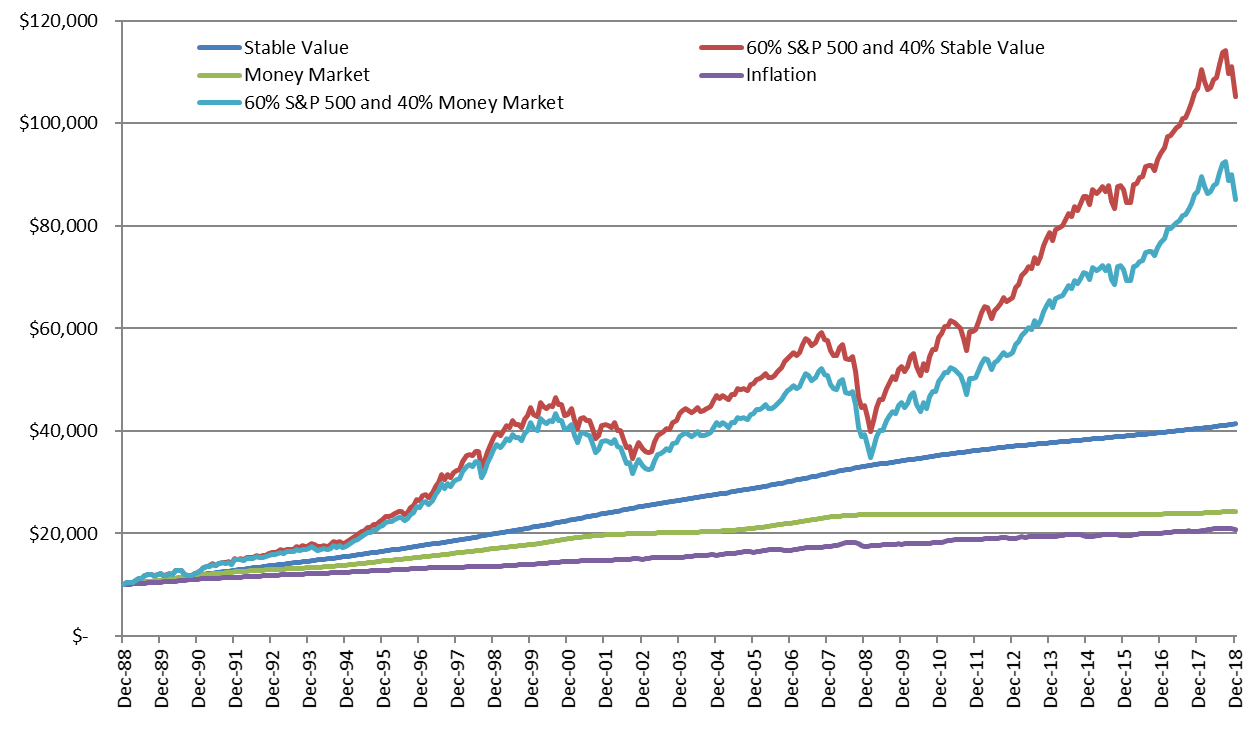
Whether or not we see short-term interest rates exceed the crediting rate on stable value funds during this cycle, focusing solely on returns over the short term ignores what stable value delivers to plan participants over the longer term: (i) principal preservation, (ii) the ability to earn returns consistent with short to intermediate-term bond funds without the volatility, and (iii) the diversification benefits provided by a fund with a low correlation to other plan asset classes (Figure 2). This value proposition remains attractive for retirement savers whether stable value is used as a significant allocation for a participant in or nearing retirement or as a diversifying allocation in a portfolio of riskier assets.
For more than 30 years, stable value funds have delivered that value proposition by protecting participants’ investments and providing steady and consistent returns that have typically exceeded those of money market funds and outpaced inflation. Further, stable value funds continue to exhibit strong fundamentals and remain well positioned to respond to the potential challenges ahead. Rising interest rates, yield curve inversions, and other market dislocations will continue to come and go in the years ahead, but the fundamental proposition of the stable value asset class will not change.
Figure 2: Growth of $10,000
Outperformance of Stable Value vs Money Market
Endnotes
- Information provided by the Federal Reserve Bank of St. Louis (http://fred.stlouisfed.org).
- Calculations are derived from H.15 data available from the Federal Reserve (http://www.federalreserve.gov/releases/h15/data.htm). Inversion periods are defined as periods when yields on 5-Year Treasuries were less than yields on the 3-Month T-bill.
- Returns shown for money market funds are represented by the Lipper Institutional U.S. Government Money Market Index. Returns shown for stable value funds are represented by the Hueler Analytics Stable Value Pooled Fund Universe Average.
- The growth of $10,000 shown in Figure 2 is a hypothetical illustration based on the growth of returns of money market funds as represented by the Lipper Institutional U.S. Government Money Market Index, stable value funds as represented by the Hueler Analytics Stable Value Pooled Fund Universe Average, and inflation as represented by the Consumer Price Index for all Urban Consumers (CPI). The hypothetical 60%/40% blended allocations are represented by a monthly rebalanced allocation of the Standard & Poor’s 500 Index and the representative proxy for money market funds and stable value funds as disclosed above.